Part I · Chapter 2
The Import-Export Landscape of India
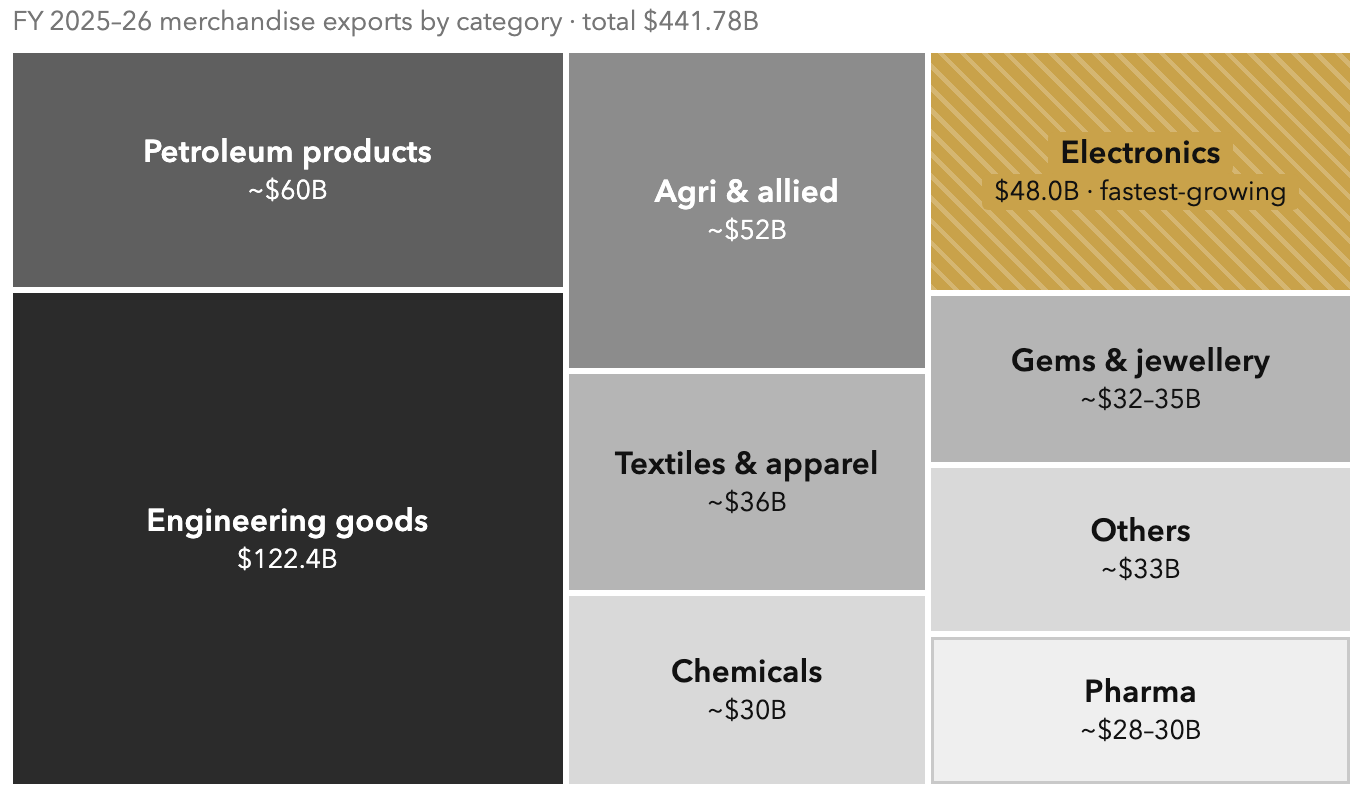
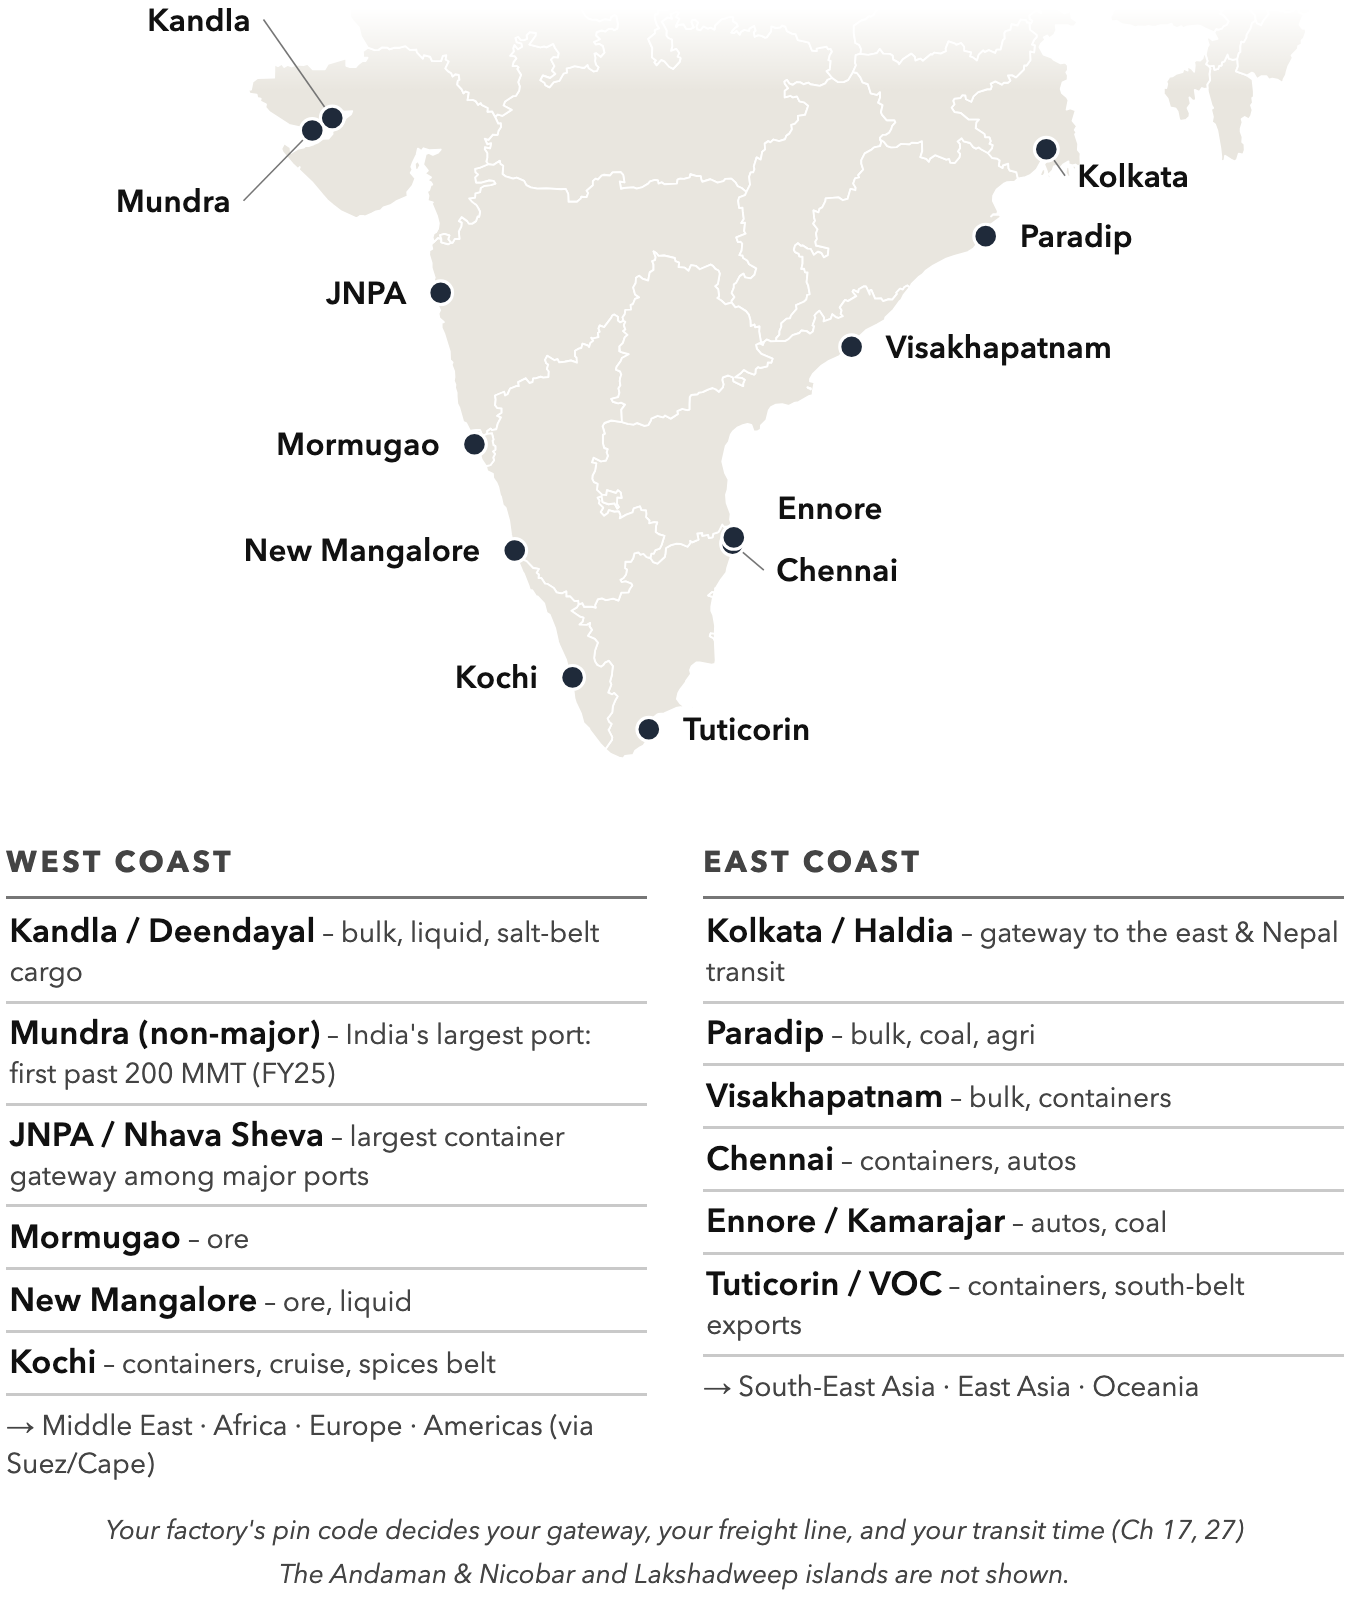
What does India actually sell to the world and buy from it today, and where inside the country is that trade made and shipped? This chapter replaces the familiar picture of spices, handicrafts and basmati with the current one, for anyone choosing a product to export or import and for overseas buyers looking for Indian suppliers. It traces how the export basket has shifted since the 1991 crisis, explains why the biggest categories are rarely the most glamorous, and reads the import bill as a market in its own right. It then maps the major ports, the long-standing manufacturing clusters and the newer planned industrial zones, and shows how a factory's location shapes freight, lead time and price. It closes with a warning about disguising where goods were made, a temptation that foreign customs data is built to expose. Afterwards you can read India's trade from current data rather than folklore, and see where a business of your size could plug into it.
Key ideas
- A category's size says little about its openness to a newcomer: the largest export lines are held by big firms, and a small trader usually enters through the suppliers that feed them.
- Trade policy can land well away from its aim: the duty meant to revive India's incense-stick makers also pushed imports toward rawer bamboo, so a new rule is best read for where it will move demand.
- Where goods are made is a commercial choice with a long tail, because the port a factory must reach and the neighbours it can call on fix part of its cost for years.